WeatherWise
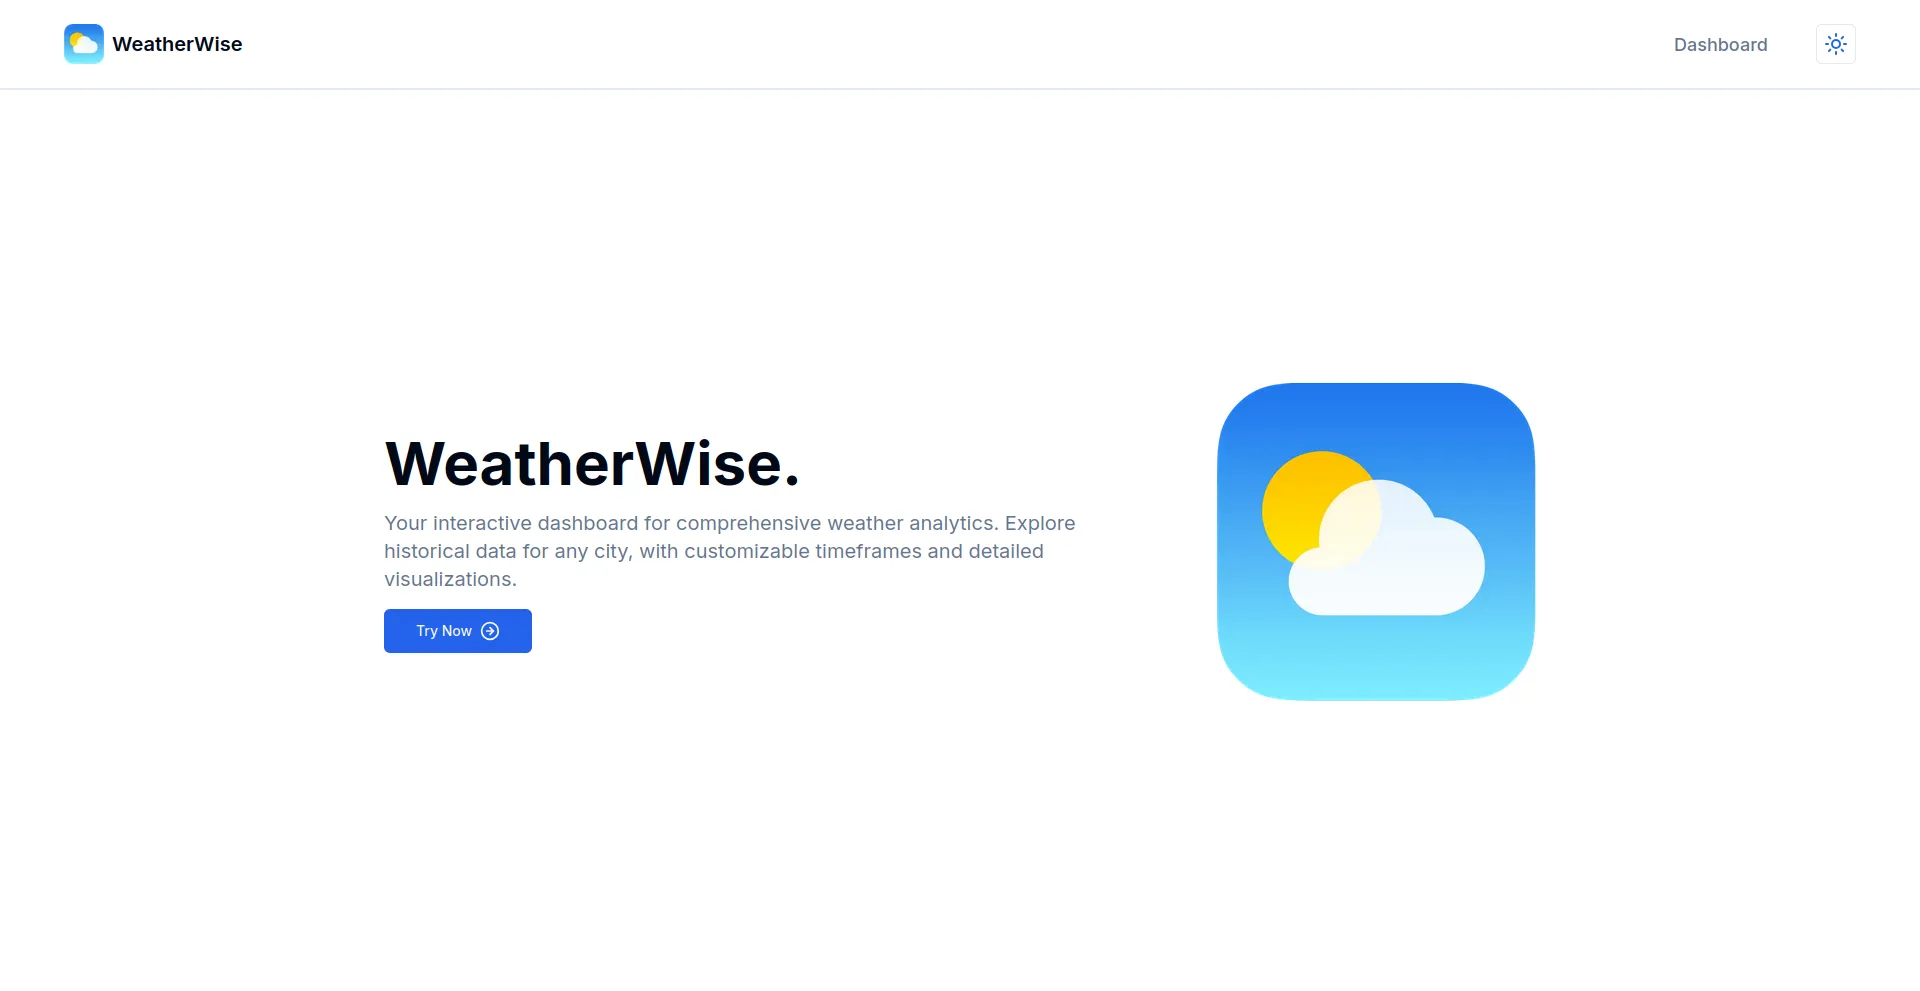
Explore historical weather data with customizable time frames and detailed visualizations.
Description
Weatherwise is the ultimate tool for weather enthusiasts and data-driven decision makers. This interactive dashboard brings comprehensive weather analytics to your fingertips, allowing you to explore historical weather data for several city. With customizable timeframes, you can dive deep into weather patterns spanning days, months, or even decades. The app's strength lies in its detailed visualizations, which transform complex meteorological data into easy-to-understand charts and graphs.
Tech Stacks


Features
- Sleek, responsive user interface featuring both light and dark modes
- Access comprehensive weather data for multiple Indonesian cities, dating back to 2014
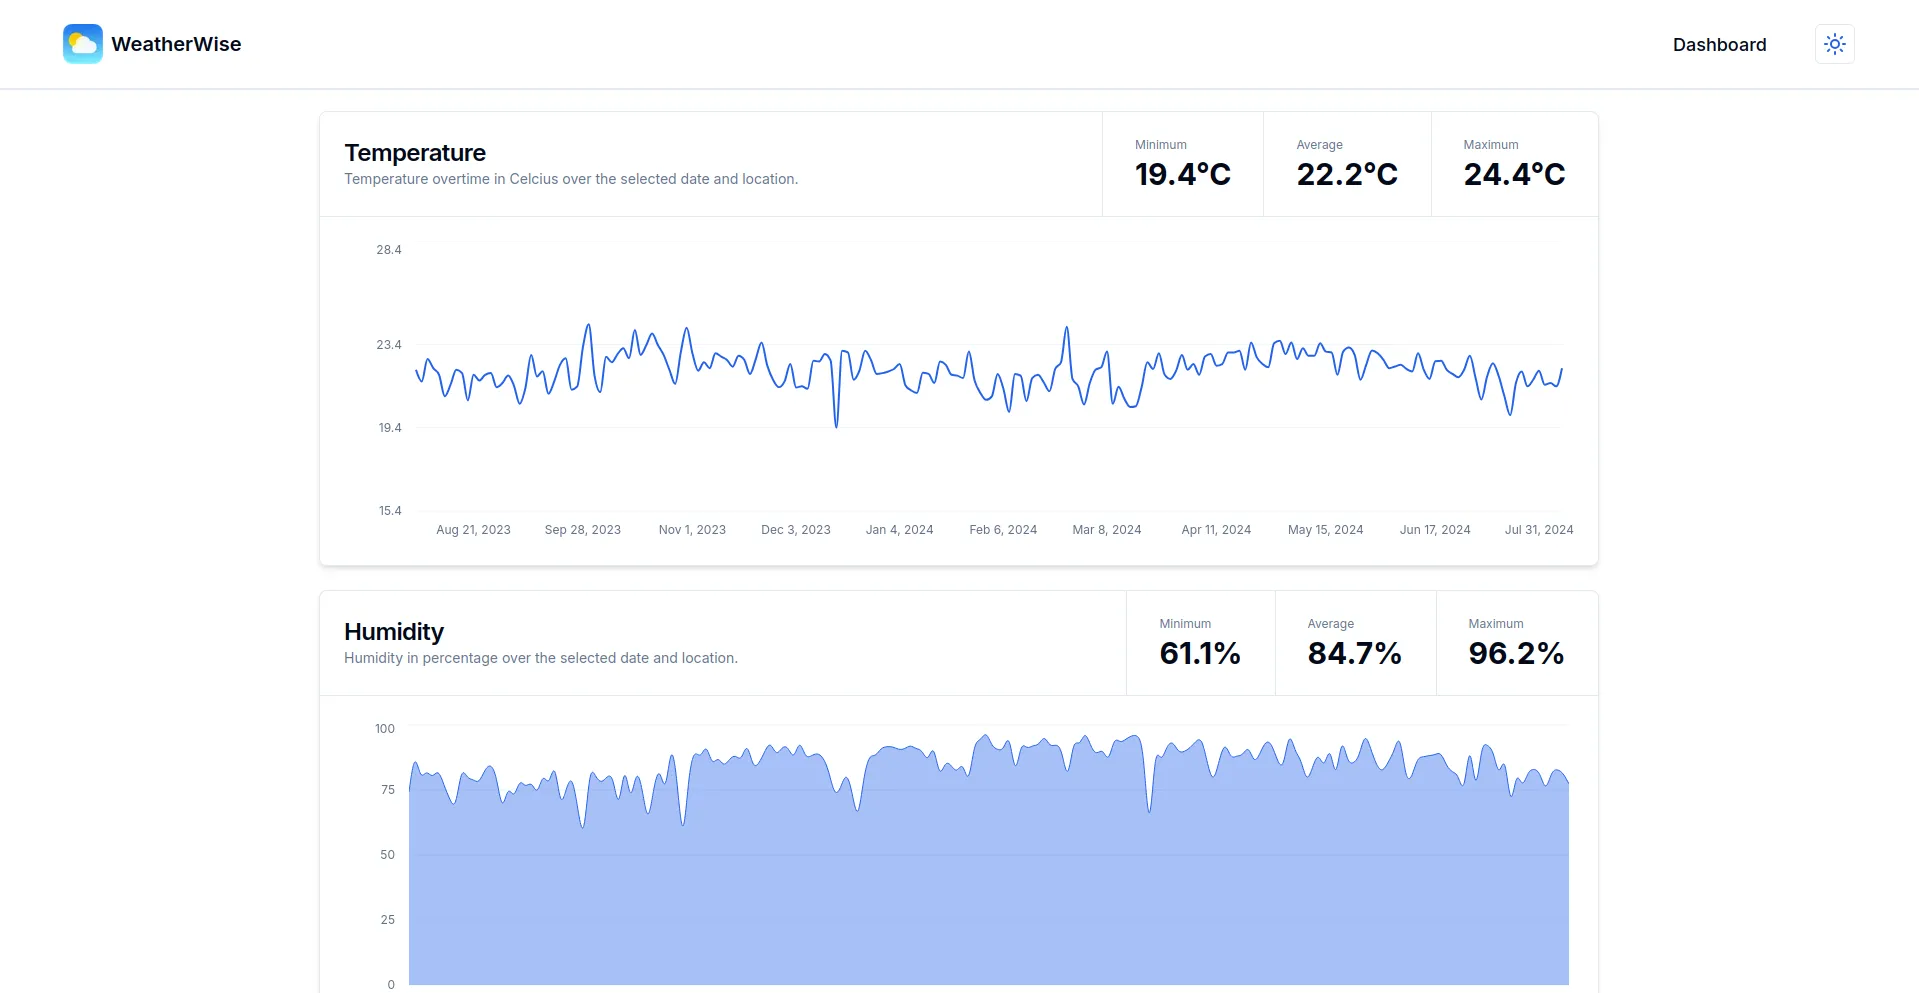
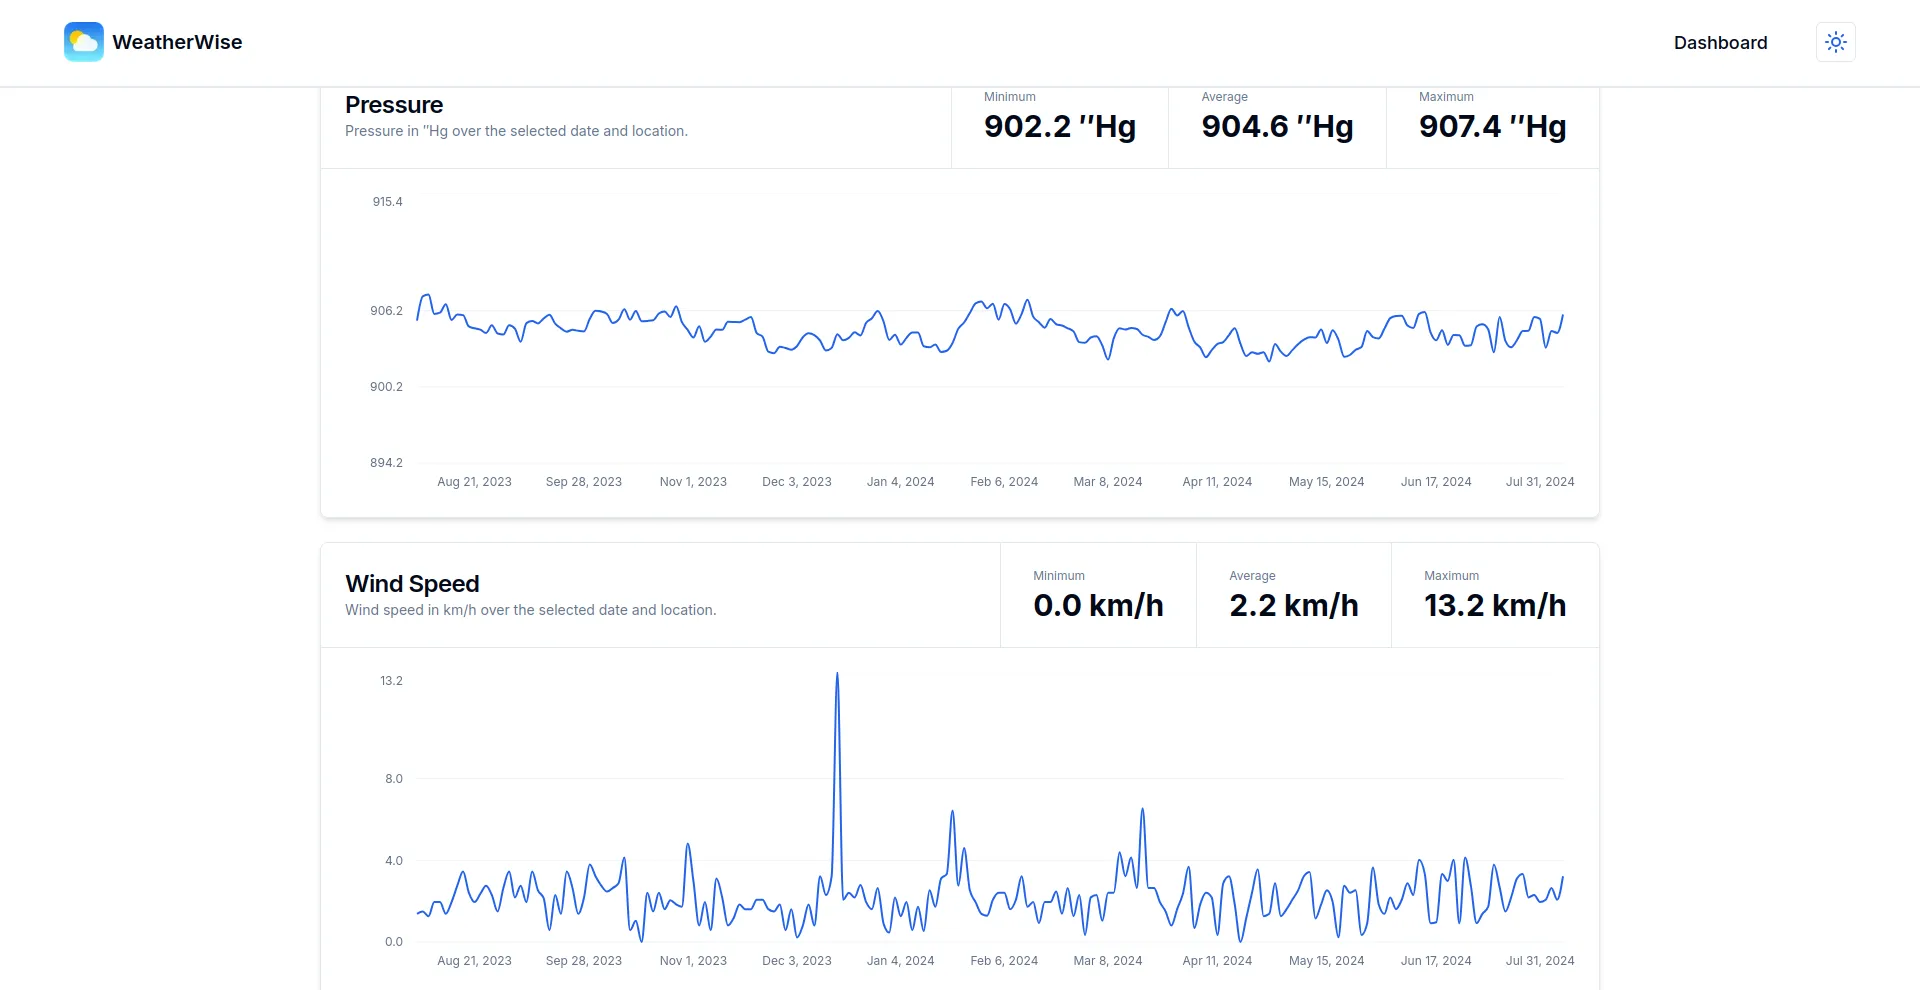
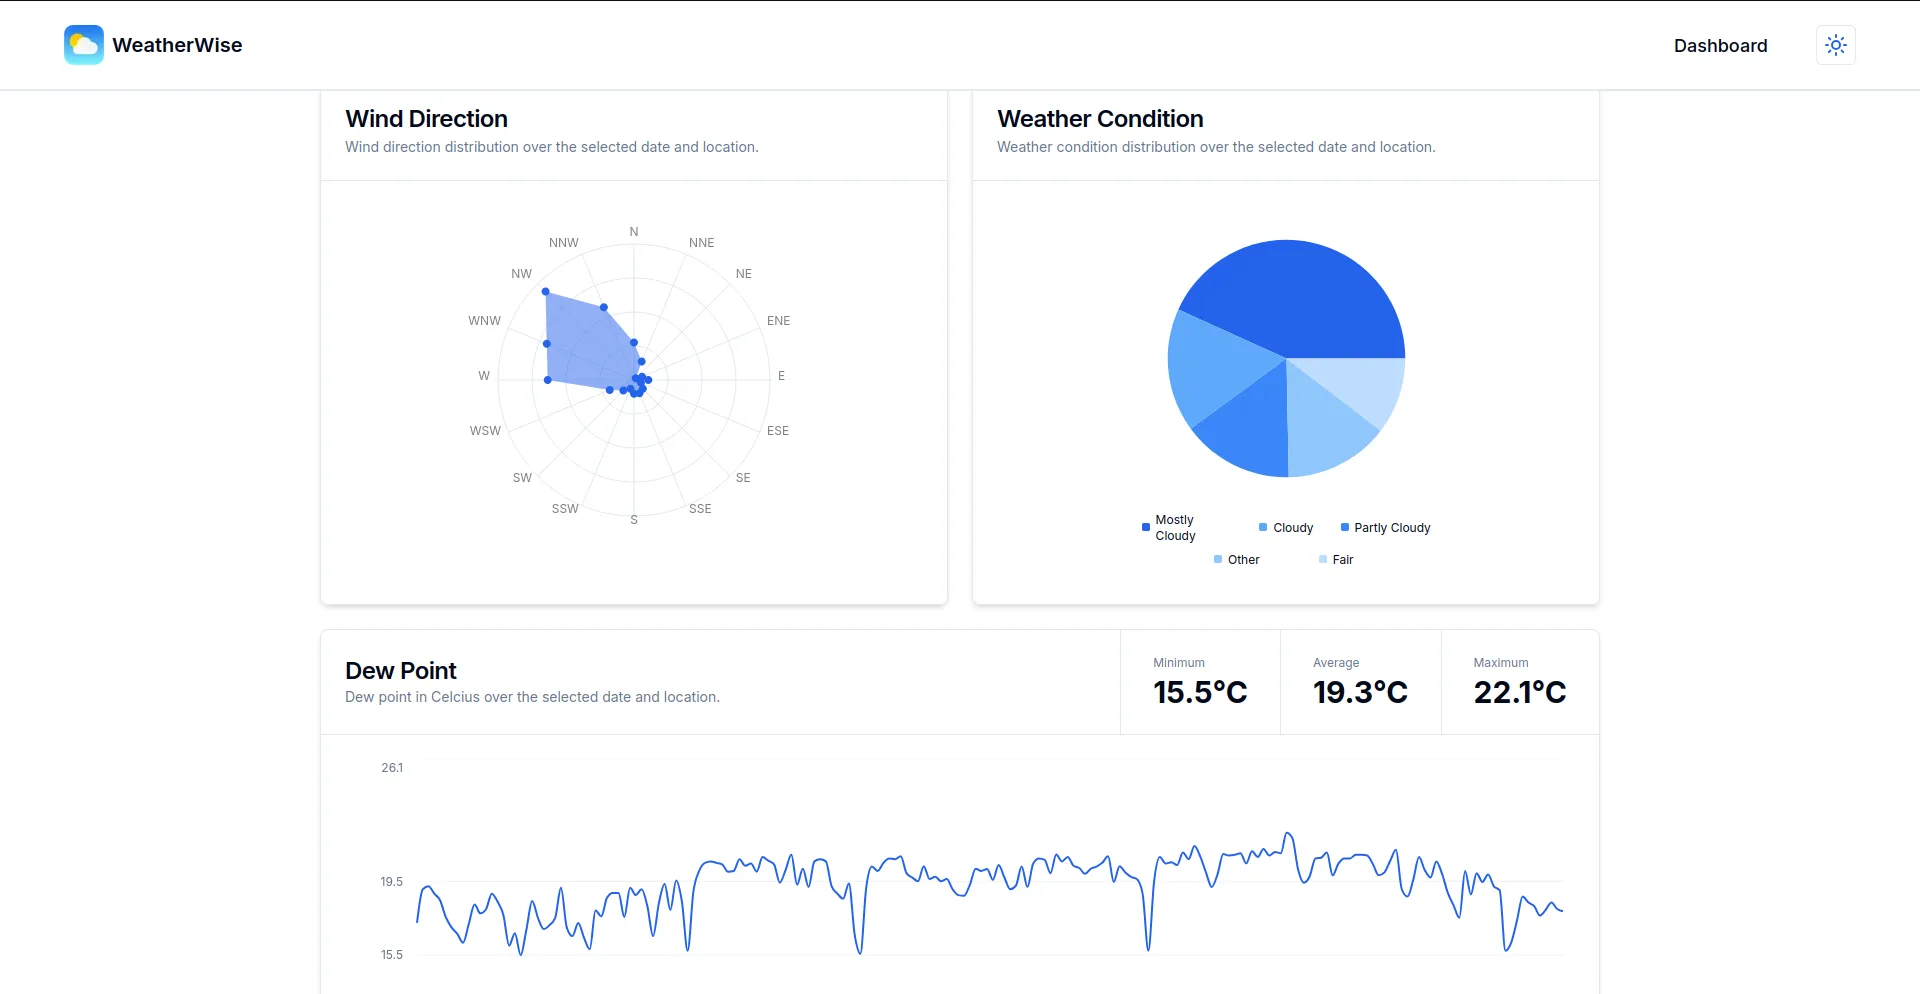
- Stunning, interactive charts that vividly illustrate weather trends over time
Development Experience
This project was an assignment for the Database Lab Assistant Recruitment at ITB. I actually applied for two laboratory assistant positions: the programming laboratory and the database laboratory. This project was the first task for the database lab assistant position. As I'm passionate about back-end development and thoroughly enjoyed the database course, I thought to myself, "Why not give it a shot?"
I chose the weather topic for an interesting reason. One day, I had planned to play basketball with my friends in my hometown one afternoon, but sadly, it suddenly started raining. I was quite disappointed because I had already made plans with my friends. This experience made me think, "Why not create a weather analytics dashboard for this assignment?" Haha!
Data Collection
For the data collection part, I scraped weather history data from wunderground . I used a library called "puppeteer" to scrape data in Node.js. The scraping process was quite challenging initially due to "too many requests" errors. However, I solved this issue by implementing a scraping queue with a concurrency count and a random delay. I also ran the scraper at midnight to avoid impacting busy hours. In the end, I successfully scraped data for four locations (Jakarta, Tangerang, Bandung, and Bali) dating back to 2014! As per the assignment instructions, the data was initially written to json files. Unfortunately, I couldn't include more data (additional locations or further back in time) since GitHub has a 100 MB file size limit. I tried using Git Large File Storage , but still, it didn't work out. I must say, puppeteer is a powerful library in Node.js for web scraping – I'll definitely be using it for future scraping needs!
Data Storage
For data storage, I used MariaDB with a Docker container. The assignment specified not to use NoSQL databases. While I usually use PostgreSQL or MySQL for my projects, I chose MariaDB to try something new (and for another reason – if you know, you know, HAHA). I didn't want to spend money on hosting a database, nor did I know of any PaaS offering a free tier service for this task (without requiring credit card information, of course), so I used docker such that it would be easy to run locally anywhere (Edit: I found a free PaaS that offers deployment with a docker container easily!). Setting up MariaDB in Docker was pretty straightforward. The relational design was also simple, as there aren't many complex entities in the weather domain. Populating the database was relatively easy – I wrote a script to read data from the previously created JSON files and insert it into the database.
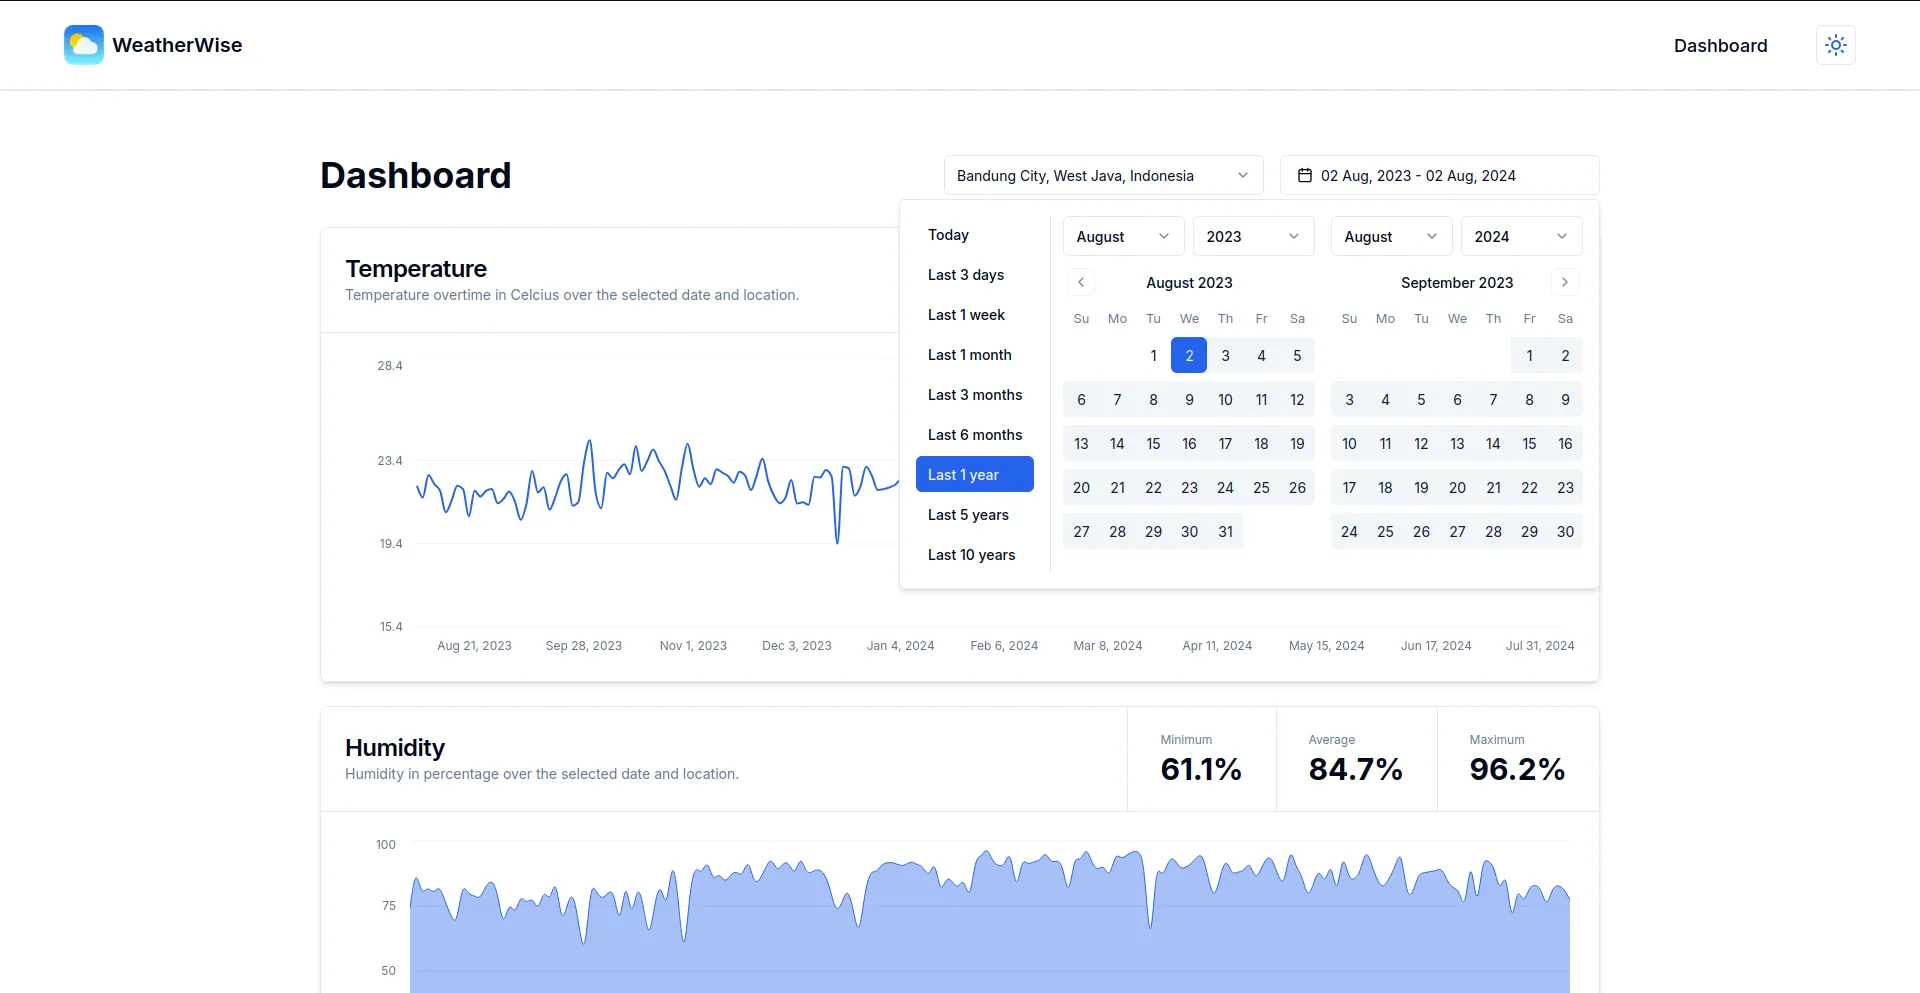
Data Visualization
For the visualization part (which was a bonus assignment), I used Next.js as I thought it was the easiest and quickest way to get the job done. I also wanted to try out the new charts component by shadcn/ui , which uses Recharts under the hood. I had to work quickly because I only had 1-2 days left before the deadline (yeah, I know the deadline was quite long, but I had other works as well). Building the app was relatively straightforward, consisting of two main pages: a home page and a dashboard page. The home page simply displays the landing page section. The dashboard page is quite interesting – it allows you to filter data based on city/location and any past date range. The filter state is saved in the URL. The charts were also simple to implement. To prevent sending too much data, I grouped and aggregated the data in sets of 300 (if the data size exceeded 300). Writing the SQL query was fun. Because I wanted to use MariaDB with a docker, I also need to containerize my Next.js application too. There were small details (commands) that needed attention to ensure the containerized Next.js app worked properly. In the end, I'm quite proud of the result.
Automated Scheduling
Last but not least, for the automated scheduling part (another bonus assignment), I wrote a Node.js script that automatically reschedules scraping of the newest data and inserts it into the database on every hour. This was quite similar to the initial scraping process but with an additional scheduler and a check to see if the data had already been scraped. One particularly challenging aspect was containerizing this app, as it turns out that containerizing a puppeteer app requires several additional steps. It involves installing chromium-browser (and its dependencies) and setting up an executable path for Chromium to run (since puppeteer simulates scraping in a browser, it needs an actual browser to function).
Reflections
In conclusion, this project was an incredibly rewarding experience. Not only did I enjoy working on this assignment, but I also gained valuable insights into various aspects of web development and data management. I significantly expanded my knowledge of the Puppeteer library and honed my web scraping techniques.


